Intro to Viz:
~~ The blistering fast edition ~~
Frank Elavsky, Data Visualization Specialist
Research Computing, Northwestern University

Chart literacy is important.
Not just for the audience, but for communicators too.
Visualization is a
Chainsaw
Use wisely.
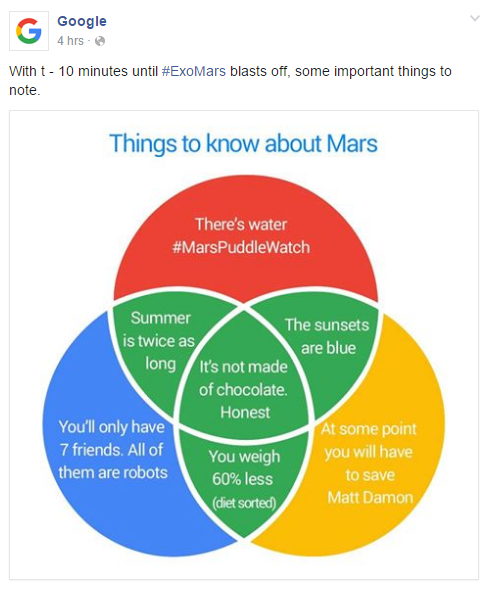
This is the chart version of a chainsaw massacre.
Think about your data! How did this happen?

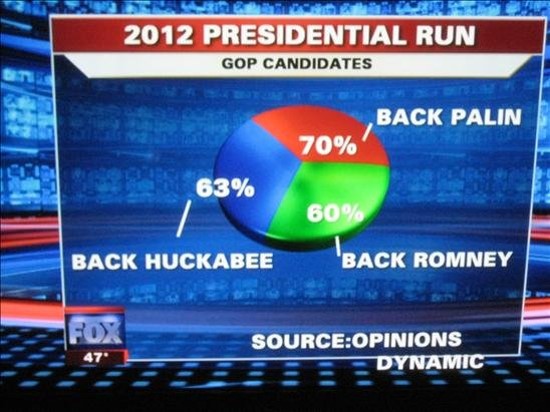
An honest mistake... or?
Poor designer put their own name on this one.
From Smashing Magazine's series: "Imagine a pie chart stomping on an infographic forever"

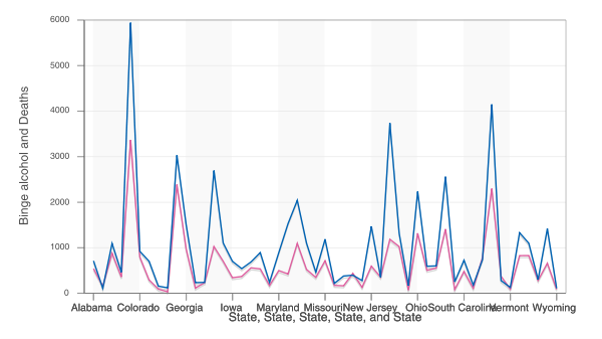
An "automated" visualization report.
Yikes.
Gestalt Principles:
Hacking the Mind
AKA: the “chainsaws of visual communication”
Proximity
(creates categories)
Similarity
(creates subcategories)
Contrast
(creates focus)
Commonality
(creates connections)
Continuity
(creates flow)
Closure
(creates suggestion)
Figure-Ground
(creates entry-point and layers)
Common Fate
(creates meta-categories)
Quick thanks to Pablo Stanley
@pablostanleyEmpathy and Awareness
Your skill in these will define whether your visualization is successful or not.
Audience, Purpose, Context
The holy triumvirate,
(consider these three things to gain more empathy and awareness.)
Audience
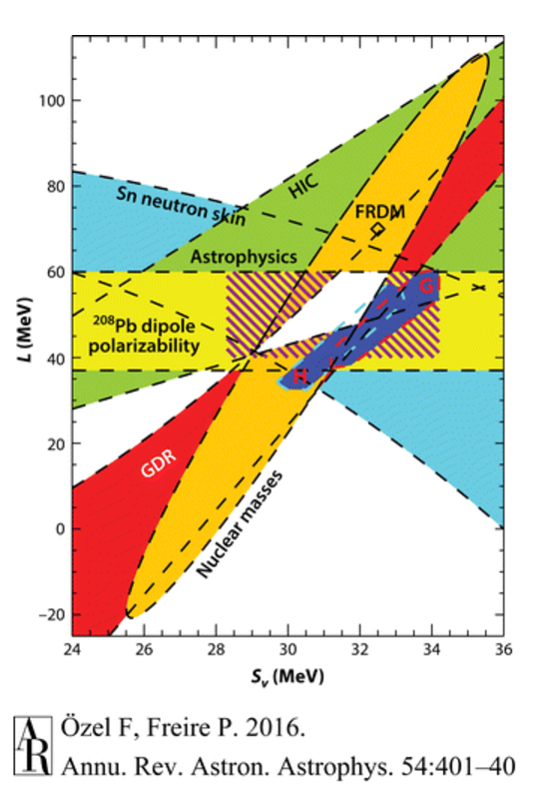
I'm not sure even astrophysists know what this means.
Disciplines intersecting over Equation of State. Ozel F, Freire P. 2016. Annu. Rev. Astron. Astrophys. 54:401-40
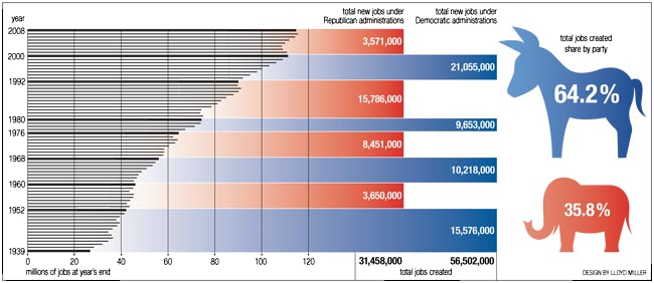
The geometry lies, but communicating data is the whole point here.
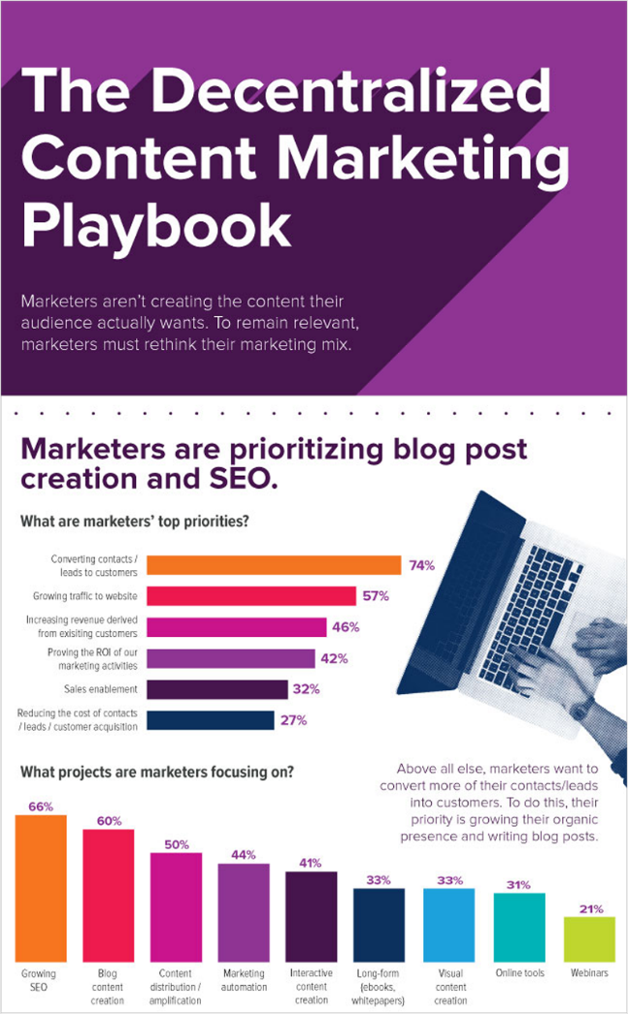
Infographics are the worst at this.

This color scale is very bad, but if meteorologists did things differently, the public would lose their minds.
Texas Storm Chasers
Purpose
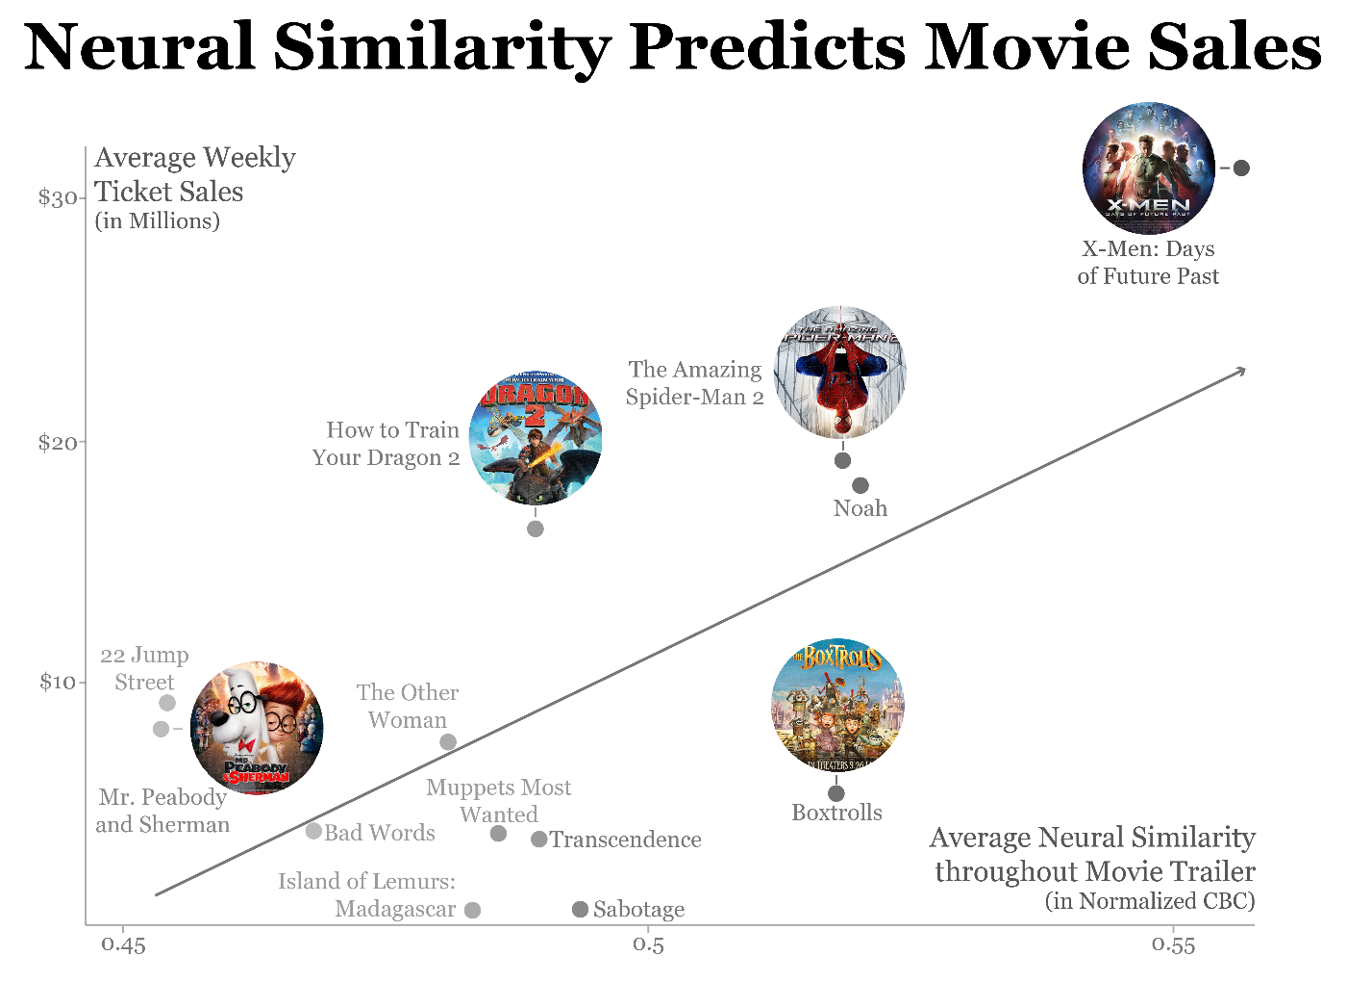
This is explaining data to a general audience - a little fluff is acceptable to keep their interest.
Brain response predicts movie sales.
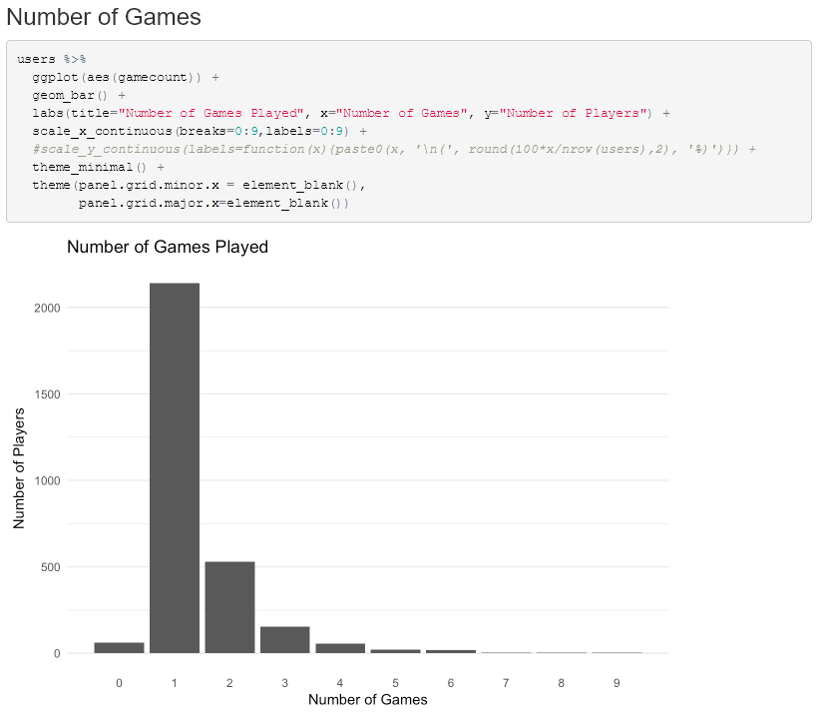
This is learning data for your own analysis - not meant to be pretty.
Using ggplot to test data

This is exploring the dimensions of the data - meant for the audience to learn something (not you)
"Is it better to Rent or Buy?"
Context
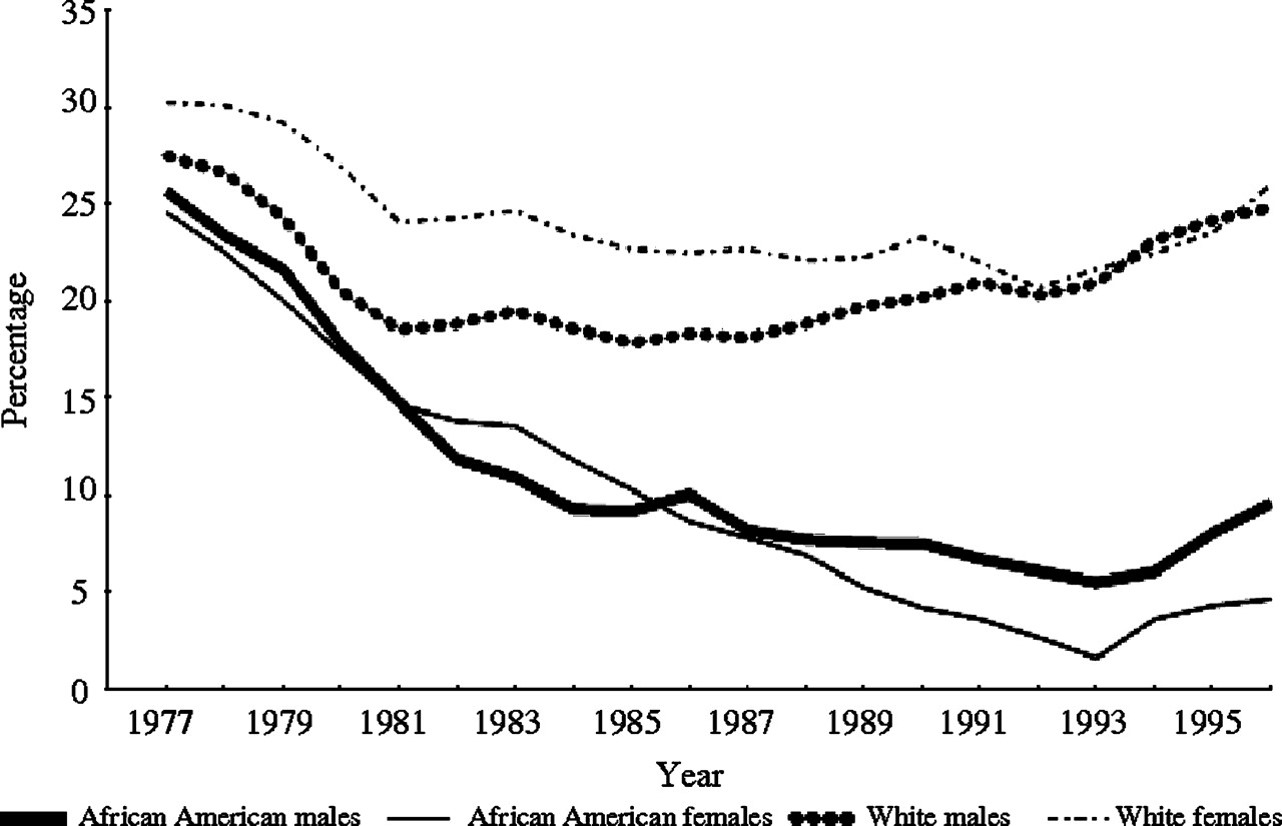
Editors: "Print. Small size. No color." (Given the context, this isn't too shabby!)
Lung Cancer Epidemiology
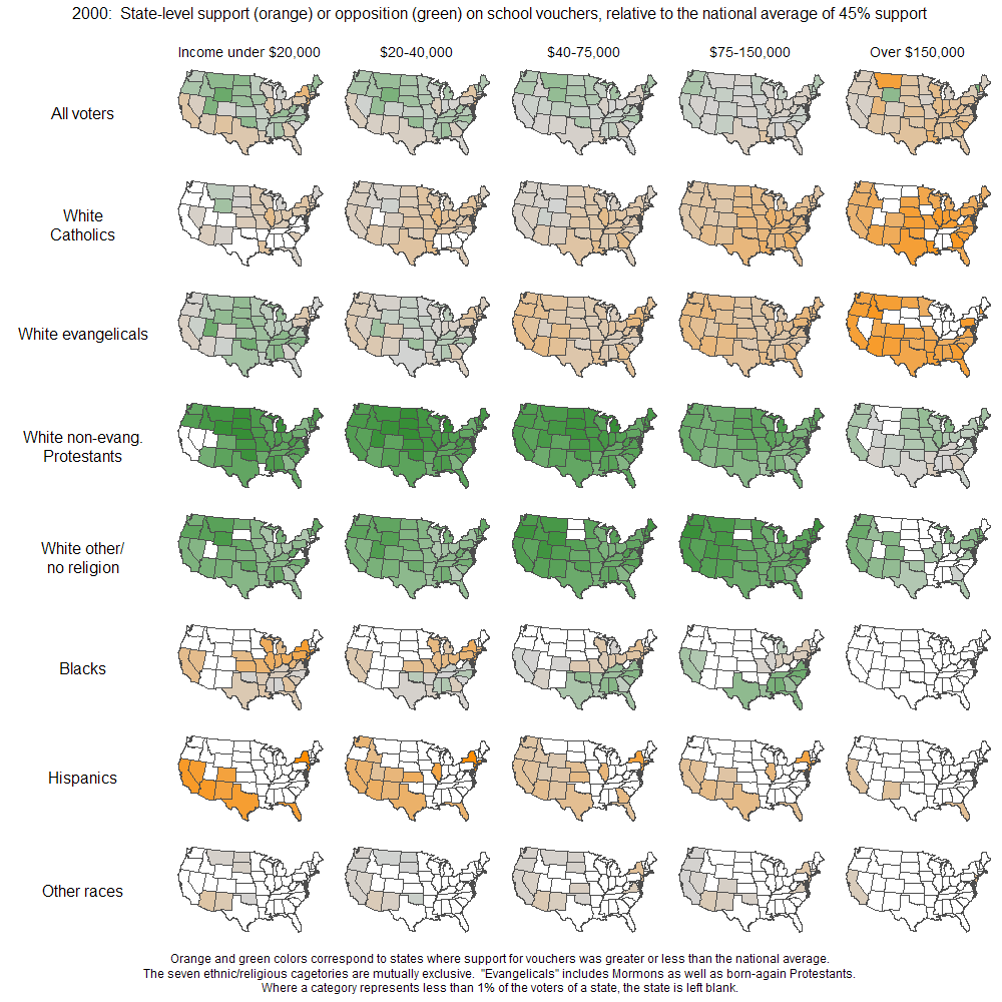
Small multiples are great for many static dimensions (if you have the room)
"Public support for vouchers"
But if your context is the web:
Your potential is the greatest: Interactive, distributed, and beautiful
Whew, what a rush.
You have all leveled up as Chart Wizards. Congrats.